Pre-Mover Demographics Survey
December 12, 2018
Photo by Thor Alvis via Unsplash
Take a minute to think about your best residential customers. How old are they? How long have they lived at their current residence? Are they homeowners or renters?
FMAdata hired a data analysis company, Predictive Analytics, LLC, to study the households included in our pre-mover data and compare them to US families in general. The report below is a demographic analysis of our Pre-Mover sales leads which highlights the unique characteristics of our audience.
Continue reading after you have given some thought to who your best customers are.
The Study:
Predictive Analytics, LLC (PALLC) recently had the opportunity to work with First Movers Advantage (FMA) to perform some deep-dive analytics. FMA provided us what appeared to be a comprehensive file of Real Estate listings from mid-year 2011 through September 2018 for the entire US. PALLC was able to leverage our big-data skills to integrate the FMA listing data with both detailed census data and a combination of "big-data" consumer and household demographics databases.
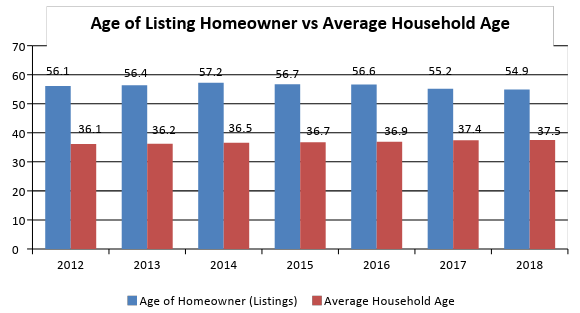
Homeowner Age
Over the past six years, the average age of the listing homeowner has been in the mid-50s while the average of households (including renters) has been in the mid-30s.
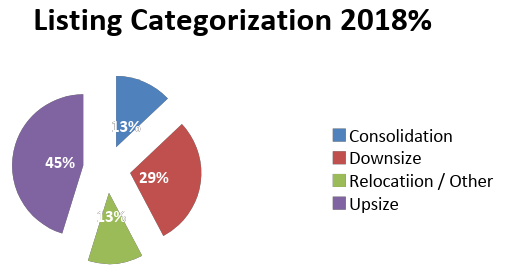
Type of Listing
The composition of listings has changed dramatically over the last few years. We have leveraged big data household composition data to categorize listings. These categories are:
-
Consolidation:
This group represents homeowners who have used the equity in their homes as a means to reduce their debt or generally reduce their payments. Consolidators are not necessarily downsizing or upsizing; they appear to be trading spaces and buying similar property types in a less affluent area. -
Downsize:
This group represents homeowners who are genuinely reducing their square footage per person. Additionally (inferentially) a fair percentage of this group appears to be in transition to condominium or townhouse life. -
Relocation / Other:
This group represents homeowners who seem to be leaving their current area. There does not appear to be any specific reason for their listing their home. -
Upsize:
This group represents homeowners who have others in the household (children or additional generations) and are seeking a bigger house.
As is illustrated in the two charts below, the composition of listings by these demographic groups has changed dramatically. It is very rare to witness this radical of a change in a statistical feature over such a short period. There is one potential explanation for this drastic change, and it appears to correlate to the radical shift in consumer sentiment. Before 2018, consumers were concerned about their general financial condition and the overall direction of the country (source government statistics office). In 2018, consumer sentiment is changing. It appears as though the pent-up demand of consumers who were holding off on moving to a larger home is finding its equilibrium. A similar, but much smaller, change is evident for consumers who are seeking to downsize. The statistic for relocation (or other) has remained surprisingly stable.
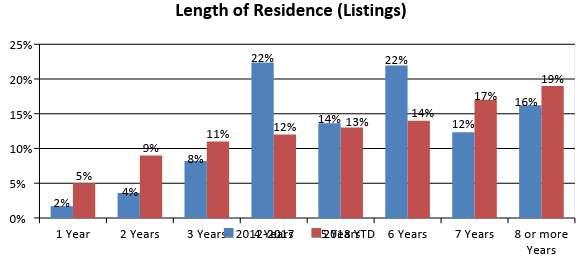
Length of Residence
The length of the residence curve is returning to a more normal pattern. As a general fact, the longer a homeowner is in their home, the more likely they are to sell their home. As is illustrated in the chart below, from 2012 to 2017 58% of listings were from homeowners who were in their house for four to six years. In 2018 the curve appears to be returning to a more normal distribution where the longer a homeowner is in there, the more likely they are to list it.
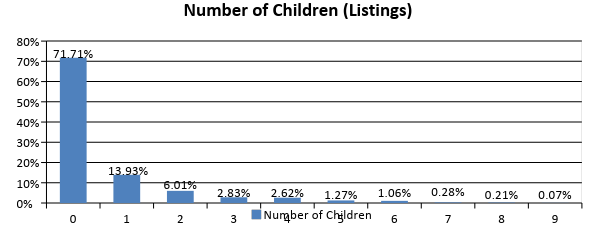
Empty Nesters
The vast majority of homes are listed by empty nesters. 72% of all homes listed since 2012 have no children present. This observation tends to support the average age of homeowner statistics above. Also, according to the US Census and supported by independent data family size is decreasing.
Listing Price
The listing price of a home is a good proxy for the overall income and wealth of the consumer. For the most part, this belief holds. There has been an equilibrium in the real estate market that supports this postulate. Lending practices prevent the consumer from "getting in over their heads" when it comes to consumer financing (not just for homes). Thus higher value homes can only be purchased by consumers with high earnings. Most of the exceptions seem to be explained by "family homesteads" that are handed down from prior generations. In these instances, the receiving generation can often not afford to maintain these high-value homes and some cannot even pay the taxes associated with the property.
Generational Differences
Since the Internet first became available to consumers in March of 1989, it has changed the way that companies communicate with consumers. Products and services are now commodities. Consumers can now purchase almost anything with one or two clicks of their mouse. For many consumers, especially the millennial and Z generations who have grown up with the internet, convenience is more important than quality. Now 41.8% of the population expects to acquire ALL goods and services via “convenient” devices in their time frame.
The Millennial Generation is rapidly becoming the largest e-commerce population demographic. As Generation Z matures, the percentage of the population that expects immediacy will continue to grow and this “new” consumer will become the majority. Now, the marketing of products and services is "scientific," matching product and service adds to the consumer's browsing and (Internet) buying history.
There are two significant exceptions to this change in behavior. The first is that most of the Digital Immigrants (the Baby Boomers, the Silent Generation, and Greatest Generation) all still prefer the more human touch and are more concerned with quality than convenience. When it comes to the matter of real-estate, the majority of transactions are from consumers categorized as Digital Immigrants. The second exception is the purchase of services when it comes to the handling and care of their possessions. This age demographic tends to be more sentimental regarding their personal property and effects.
The combination of these two facts suggests that digital marketing of products and services associated with the sale and subsequent moving require a more high-touch / personal approach.
Summary
Thinking back to your mental picture of your best customers, did you think they would be older & more affluent than the average household? Did you imagine that they have been in their homes for a while and will have more stuff to move (i.e., big jobs)? If so, our pre-mover list represents the marketing audience that will help you maximize revenue and return on your marketing budget. Contact us today at (833)410-DATA (3282).